library(tidyverse)
library(ggformula)Setting up R Packages
Our first graph
Let us look at the variable names:
penguins %>% names()[1] "species" "island" "bill_len" "bill_dep" "flipper_len"
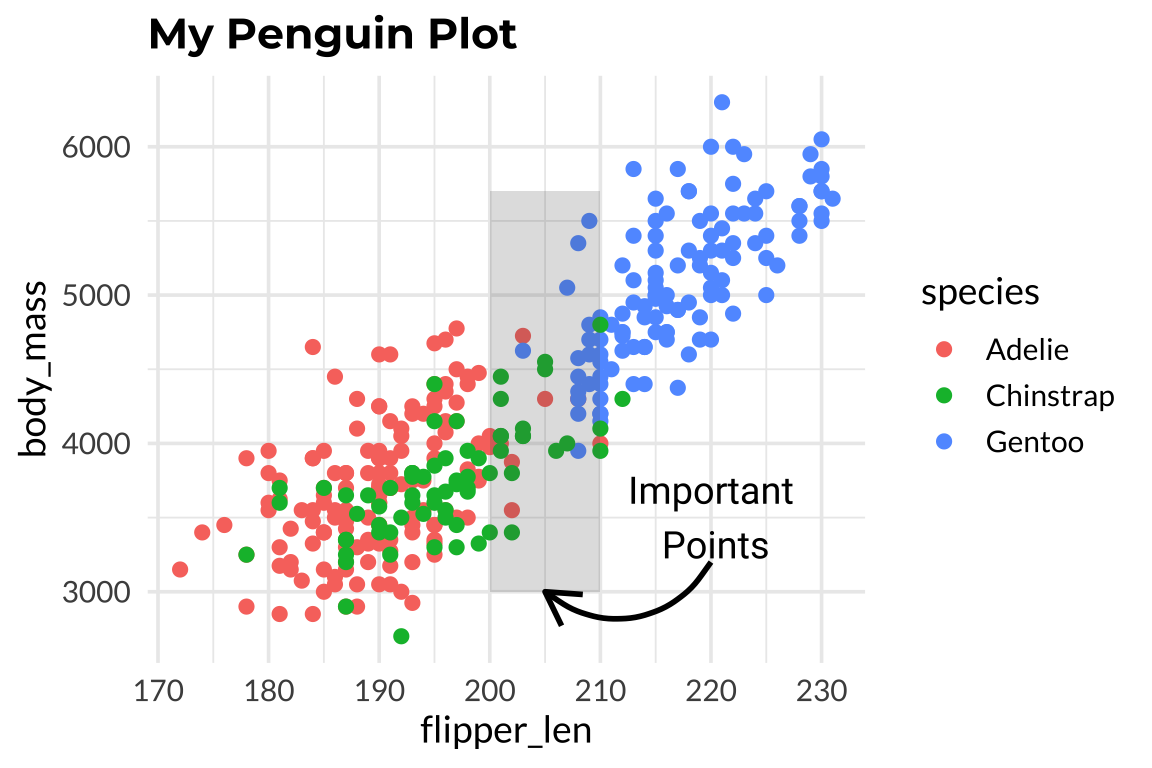
[6] "body_mass" "sex" "year" OK, let’s do a scatter plot:
penguins %>% drop_na() %>%
  gf_point(body_mass ~ flipper_len, colour = ~ species, size = 2) %>%
  gf_labs(title = "My Penguin Plot") %>%
  gf_refine(annotate(geom = "text", label = "Important\n Points", x = 220, y = 3500, size = 5),
            annotate(geom = "rect", xmin = 200, xmax = 210, ymin = 3000, ymax = 5700, alpha = .2),
            annotate('curve',x = 220, y = 3200,yend = 3000,xend = 205,
linewidth = 1, curvature = -0.5, arrow = arrow(length = unit(0.5, 'cm'))))